
The Hidden Cost of Manual Compliance Tracking in Medical Device Manufacturing
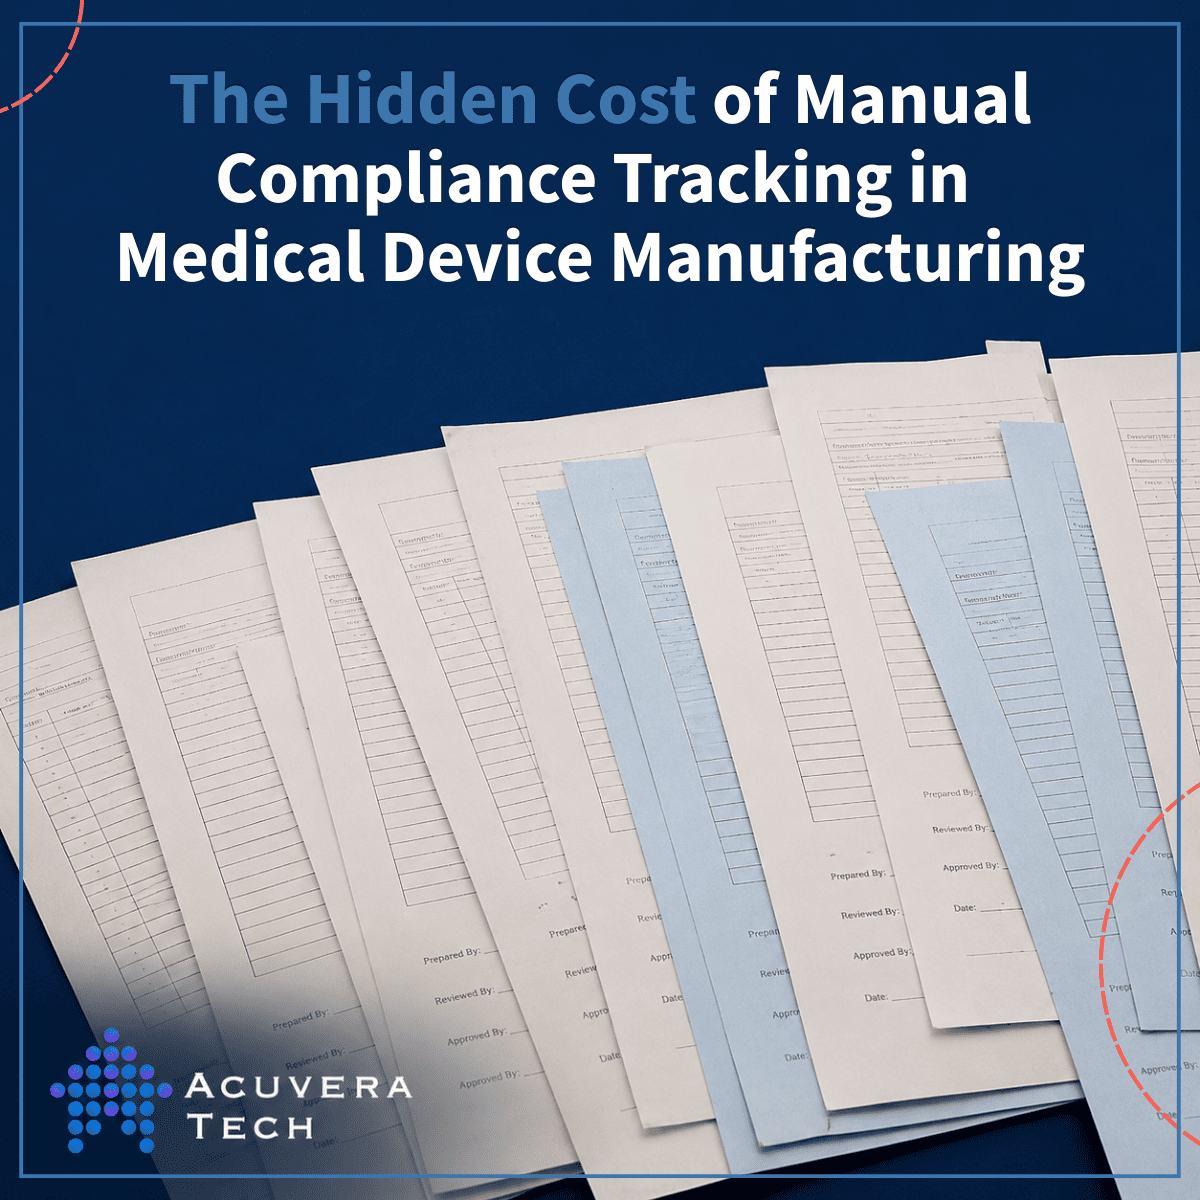
It’s Thursday afternoon and a customer is waiting on a lot release. Your quality engineer is standing at a filing cabinet with a half-signed device history record, trying to establish whether the incoming inspection sheet for one component was ever scanned. If it was, which of three shared drives did it land on?
Nobody logs that hour. It never appears as a quality cost, a compliance cost, or a shipping delay. It just happens, several times a week, at medical device manufacturers across the country.
That is the defining feature of manual compliance tracking.
The labor you already pay for but never measure
Spreadsheets and paper records feel cheap because they carry no line item. McKinsey documented a device manufacturer whose paper-based device history records ran to hundreds of pages each and held thousands of quality data points, creating close to 100 opportunities for documentation error every single day. After replacing that system with a closed-loop electronic one, documentation errors fell to zero, production noncompliance reports dropped 41%, and overall productivity improved 6-10%.
Read that last figure again. The manual process was consuming somewhere between 6 and 10% of productive capacity, and it had never appeared on a budget. That is what we mean by hidden cost: not money you spent poorly, but money you never saw leave.
Audit prep is a recurring project nobody scoped
Ask a quality manager what the two weeks before an inspection look like. You will hear about reconstructing training records, chasing signatures on documents from months ago, and rebuilding a traceability chain that exists in fragments across a QMS binder, a production spreadsheet, and one engineer’s memory.
That work has become harder to defer. On February 2, 2026, the FDA’s Quality Management System Regulation (QMSR) took effect, amending the device CGMP requirements of 21 CFR Part 820 to incorporate ISO 13485:2016 by reference. On the same date, the FDA retired the Quality System Inspection Technique (QSIT) and began inspecting under an updated compliance program. Procedures, terminology, and risk-management expectations all shifted. If your evidence of compliance lives in binders and personal spreadsheets, every one of those changes has to be traced by hand, document by document.
What FDA investigators are actually citing
Corrective and preventive action (21 CFR 820.100) remains the most frequently cited area in device inspections. The common failures are inadequate root cause analysis, missing effectiveness checks, and poor documentation of the corrective actions themselves – and CAPA deficiencies are often the tipping point that escalates a Form 483 into a warning letter. Design controls, complaint handling, purchasing controls, and UDI labeling round out the top five.
Look at that list again. Most of those are documentation and traceability failures where the organization knew the right thing, and could not prove it inside an inspection window. Counsel tracking the 2025 inspection cycle reported 19 device quality-system warning letters by early September, against 12 at the same point in 2024, and noted that firms with unresolved CAPAs and inconsistent documentation are being flagged for inspection earlier by FDA’s data-driven targeting tools.
Delayed lot release is a working capital problem
When a lot sits in quarantine waiting on a signature or a missing inspection record, that is finished goods you have already paid to produce and cannot yet invoice. Multiply a two-day average hold across a year of lots and the number stops being a quality annoyance and starts being a cash conversion cycle problem (one your CFO is measuring without necessarily knowing what causes it).
Scrap and rework from traceability you find out about too late
Manual traceability is not just slow, it is retrospective. You discover the nonconforming component after it has been built into 400 units rather than at incoming inspection, because the link between supplier lot and work order lives in a spreadsheet somebody updates on Fridays.
McKinsey puts routine internal quality failures – rejects, rework, and deviation management – at roughly 2.1 percent of annual sales, inside a total direct cost of quality of 6.8 to 9.4 percent of sales for the device industry. Around two-thirds of that total is the cost of poor quality rather than the cost of ensuring good quality. Narrowing the gap between when a problem occurs and when you can see it is most of the work.
The cost compounds faster than you scale
Manual compliance tracking has an unpleasant scaling property: the effort grows faster than the volume. One facility, two product lines, thirty people – a shared spreadsheet genuinely works. Add a second site, a contract manufacturer, a new 510(k) configuration, and a European market, and the number of records does not double. The number of relationships between records does.
This is also where regulators have tightened. Sponsors are increasingly held accountable for oversight of their contract manufacturers, and acquiring companies are being cited for quality processes and legacy documentation they inherited. Manual systems handle their own four walls tolerably. They handle a network of suppliers, sites, and acquired product lines very poorly.
A more useful question than “should we automate?”
Before evaluating any solution, it is worth simply measuring what you have. Pick your last three lot releases and time how long the record review actually took. Count how many separate systems a single device history record touches. Ask your quality team how many hours the last audit preparation consumed, and what they stopped doing to make room for it.
Most operations leaders find the number larger than they expected, and that alone reframes the conversation – from a technology purchase to a cost that is already being paid, just not counted.
If you would like a straightforward framework for auditing your current compliance tracking process, we are happy to share the one we use. No pitch, no demo – just a structured way to see where the hours and the risk are actually going.
Sign Up to Receive the Free Assessment Below